Video Games Data Analysis
Many videos games are published annually from a variety of companies across platforms and genres. With this variety comes different critic/audience responses. Some websites like VGChartz provide data on video game charts, game sales, top sellers, and overall game data. Additionally, metacritic provides critic ratings for each game upon release. Kaggle has considated data from both sources into one dataset.
Figure 1.1 below shows a comparison between the critic score/count and the user score/count for each video game with the scores using the right axis and the counts using the left axis. They show that there isn't a direct correlation between number of users and their scores and the same for critics.
Figure 1.2 below shows a comparison between global sales in millions and critic/user score. The bar graph has each point labeled, and show that the two scores consistently differ from each other. While the critic score is always significantly higher than user score, so do the global sales. Even though there are many wavering factors, the graph shows that the best selling console game has consistently been the Wii where global sales are significantly high and high critic scores even though they have low user scores. This shows that while critics may have favorable impressions towards certain games, users may not share those same ideas.
Figure 1.3 below shows the relationship between critic score and genre. The genres that have high critic scores are action and racing, while misc and puzzle games consistently fall short and sport games are in the middle. This shows that there is a relationship between genre preference and high critic score, however like all data, it can reveal the underlying bias as critics prefer one genre over others.
| Name | Platform
What console/where the game was released
|
Year_of_Release
When the game was released
|
Genre
Genre of the game
|
Publisher
Who published the game
|
Critic_Score
Aggregate score compiled by Metacritic staff
|
Critic_Count
The number of critics who participated in deciding the critic score
|
Global_Sales
Total worldwide sales (in millions)
|
User_Score
Score by Metacritic's subscribers
|
User_Count
The number of users who participated in deciding the user score
|
|---|---|---|---|---|---|---|---|---|---|
| Grand Theft Auto V |
PS3 |
2013 |
Action |
Take-Two Interactive |
97 |
50 |
21.12 |
8.2 |
4009 |
| Grand Theft Auto: San Andreas |
PS2 |
2004 |
Action |
Take-Two Interactive |
95 |
80 |
20.81 |
9 |
1606 |
Grand Theft Auto: Vice City |
PS2 |
2002 |
Action |
Take-Two Interactive |
95 |
62 |
16.15 |
8.7 |
736 |
Gran Turismo 3: A-Spec |
PS2 |
2001 |
Racing |
Sony Computer Entertainment |
95 |
54 |
14.98 |
8.4 |
314 |
Mario Kart DS |
DS |
2005 |
Racing |
Nintendo |
91 |
64 |
23.22 |
8.6 |
465 |
New Super Mario Bros. |
DS |
2006 |
Platform |
Nintendo |
89 |
65 |
29.81 |
8.5 |
433 |
New Super Mario Bros. Wii |
Wii |
2009 |
Platform |
Nintendo |
87 |
80 |
28.38 |
8.4 |
595 |
Mario Kart Wii |
Wii |
2008 |
Racing |
Nintendo |
82 |
73 |
35.57 |
8.3 |
712 |
Wii Sports Resort |
Wii |
2009 |
Sports |
Nintendo |
80 |
73 |
32.78 |
8 |
193 |
Wii Fit |
Wii |
2007 |
Sports |
Nintendo |
80 |
63 |
22.7 |
7.7 |
146 |
Wii Fit Plus |
Wii |
2009 |
Sports |
Nintendo |
80 |
33 |
21.79 |
7.4 |
52 |
Wii Sports |
Wii |
2006 |
Sports |
Nintendo |
76 |
51 |
82.54 |
8 |
324 |
Brain Age: Train Your Brain in Minutes a Day |
DS |
2005 |
Misc |
Nintendo |
77 |
58 |
20.15 |
7.9 |
50 |
Brain Age 2: More Training in Minutes a Day |
DS |
2005 |
Puzzle |
Nintendo |
77 |
37 |
15.29 |
7.1 |
19 |
Kinect Adventures! |
X360 |
2010 |
Misc |
Microsoft Game Studios |
61 |
45 |
21.86 |
6.3 |
106 |
Wii Play |
Wii |
2006 |
Misc |
Nintendo |
58 |
41 |
28.92 |
6.6 |
129 |
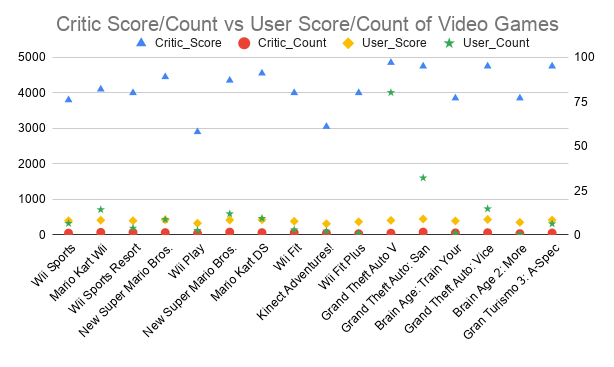
Figure 1.1
 Compared to Critic and User Score of Video Games.png)
Figure 1.2
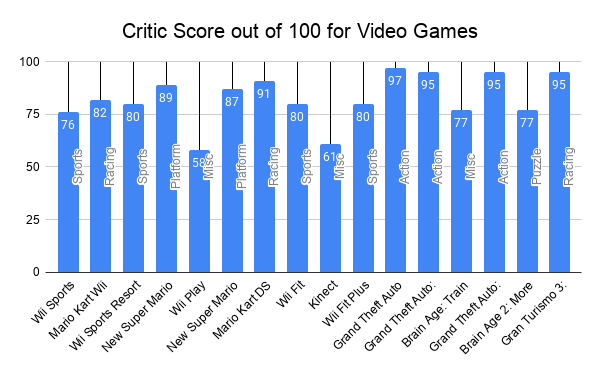
Figure 1.3